The greatest joy of a mother lies in the ability to see her children grow up to become responsible adults who can generate enough income to take care of their needs. Little wonder a good mother always ensures to imbue her children with the necessary life skills that will prepare them to become independent individuals.
Now, let us imagine Nigeria as a mother and the thirty-six federating states as her children. When the country’s successive governments split up the initial regional governments, the plan was to empower these states with autonomy and the ability to generate their own revenues. In other words, Nigerian states were created with the expectation that they independently administer their affairs and coordinate their development, without undue interference from the Federal Government. Unfortunately, this has not quite been the case.
A recent review of the Federal Government’s Fiscal Allocation and Statutory Disbursement (FASD) by the Nigeria Extractive Industries Transparency Initiative (NEITI), revealed that the selected states are over-dependent on Mineral Revenue (MR). The review covered a five-year period between 2012 and 2016.
Sources of Revenue for State Governments
The NEITI review further highlighted three major categories of revenue allotment to state governments in Nigeria. These are Mineral Revenue (MR), Non-Mineral Revenue (NMR), and Internally Generated Revenue (IGR). A breakdown of the various sources of the Total Revenue (TR) from 2012 to 2016 is displayed below:
Table 1: MR Components of the Total Revenue of Selected State Governments (2012 – 2016)
State | Total Revenue | % of MR | % of NMR | % of IGR |
Delta | 1,382.600 | 52 | 31 | 18 |
Kano | 631.768 | 43 | 29 | 28 |
Imo | 600.322 | 32 | 46 | 22 |
Ondo | 481.936 | 51 | 39 | 10 |
Nasarawa | 277.804 | 53 | 39 | 9 |
Gombe | 387.709 | 40 | 52 | 8 |
Bayelsa | 1,028.861 | 59 | 36 | 4 |
Source: OAGF Disbursement Schedule 2012 – 2016 & State Validated Templates
The table above shows an obvious over-reliance by states on MR, which was between 40% and 59%. Bayelsa State topped the chart, with Gombe State at the other extreme, representing the least.
In general, the states have a poor pool of Internally Generated Revenue (IGR). Kano State has the highest percentage of 28% which, by the way, is still poor. Bayelsa, on the other hand, has just 4% which is very poor. The table below shows the implication of the low IGR recorded by these states within the period under review.
Table 2: IGR to Liabilities of Selected State Governments
State | IGR (N’000) | Staff Emoluments/Inc. Pension/Liabilities (N’000) | Excess/Deficit (N’000) |
Delta | 242.064 | 387.349 | -145.285 |
Kano | 176.386 | 197.068 | -20.682 |
Imo | 133.055 | 66.031 | 67.024 |
Ondo | 46.954 | 146.528 | -99.574 |
Nasarawa | 45.386 | 184.293 | -138.907 |
Gombe | 31.57 | 86.7 | -55.13 |
Bayelsa | 24.195 | 73.956 | -49.761 |
Source: FASD Summary Report 2012 – 2016 Fiscal Year
The NEITI report revealed that the states did not generate enough revenue internally to offset their major expenses, thus the continuous dependent on MR.
Some indicators
The NEITI report identified some possible implications, chief among which is the exposure to internal and external loans. Any negative and unexpected volatility in the oil and gas market could adversely affect the economic and political growth of the states and by so doing, impact on their sustenance and ability to administer their functions.
The Way Forward
As rightly put forward by the NEITI review, the state governments should re-evaluate their revenue profile and come up with articulated and strategic plans to exploit their full internal economic potentials. The intent is to ensure the equalisation of their social and economic cost-benefit analysis.
For instance, Delta State of Nigeria with a population of 4.8 million people (as at 2017), has a very strong recurrent-capital expenditure ratio; thus enhancing her chances of attaining economic development.
Not that the recurrent to capital expenditure ratio has always been an issue of debate in top economic propaganda. This, among other things, shows the level of progress of an economy. Most times, it could also be used to predict with some level of certainty, the development agenda of an economy.
The Fiscal Allocation and Statutory Disbursement (FASD) of the Federal Government from 2012-2016 by NEITI also reviewed the recurrent-capital expenditure ratio of some selected states in an attempt to ascertain the direction of economic progress.
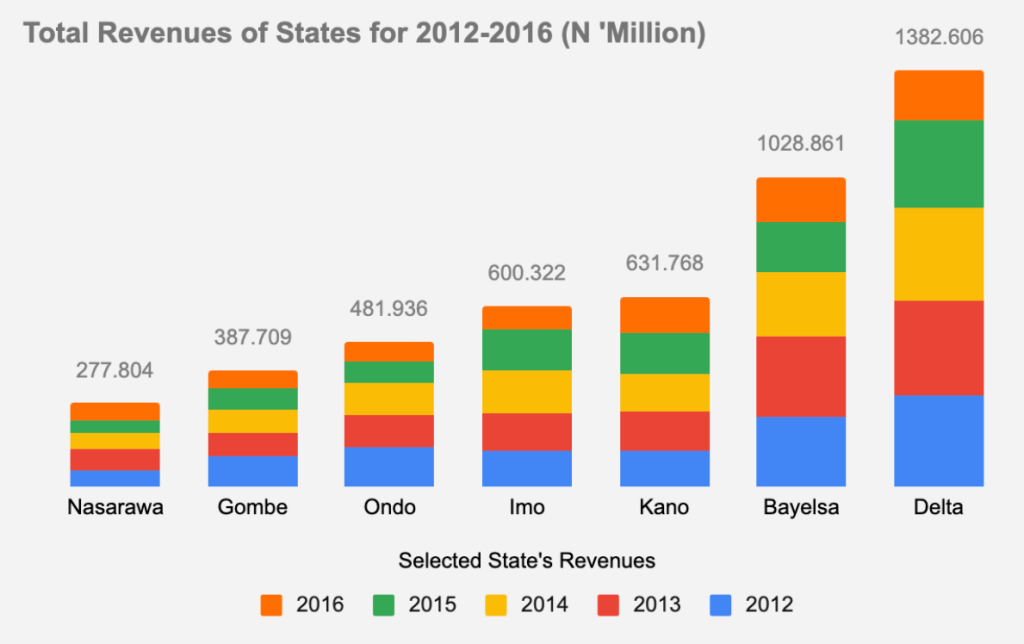
The report provided details of the revenue generated and received by these states, which show the different components of Mineral Revenue (MR), Non-Mineral Revenue (NMR) and Internally Generated Revenue (IGR). The figure below shows the total revenue of these states.
Of the states reviewed, Delta State has the highest pool of revenue with Nasarawa State being the least. All (or at least most) of the expenditures of states is a proportion of their revenue pool. This implies that the revenue generated is spent in different proportions on recurrent and capital expenditures. The NEITI report revealed the percentages of their revenue spent on recurrent and capital expenditures. Below is an analysis of their spending on recurrent expenditure.
Table 1: Percentage of Recurrent Expenditure to Total Revenue
State | 2012 | 2013 | 2014 | 2015 | 2016 |
Delta | 54% | 55% | 67% | 75% | 90% |
Kano | 48% | 47% | 46% | 43% | 53% |
Imo | 76% | 64% | 68% | 70% | 60% |
Ondo | 60% | 66% | 74% | 95% | 85% |
Bayelsa | 67% | 65% | 74% | 69% | 61% |
Gombe | 41% | 63% | 66% | 71% | 78% |
Nasarawa | 82% | 68% | 90% | 86% | 70% |
Source: FASD Summary Report 2012 – 2016 Fiscal Year
The table above shows that Delta State, which generated more revenue, spent a huge percentage of its total revenue on recurrent expenditure in increasing proportion. For example, the state spent 54% of its total revenue on recurrent expenditure in 2012, and by 2016, this had risen to 90%.
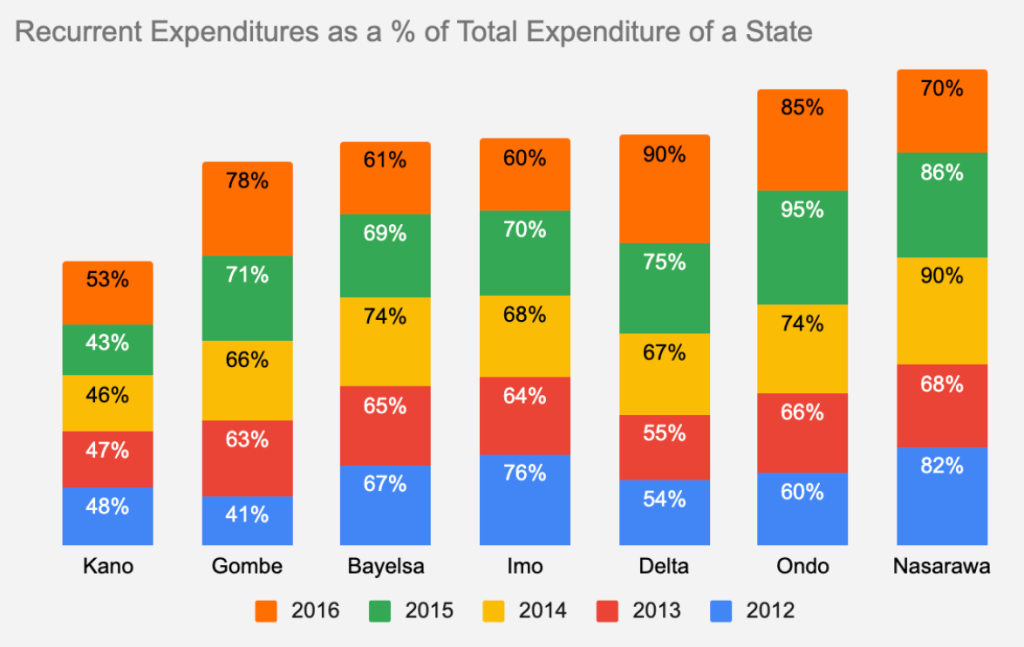
However, a closer look at these percentage figures reveals something rather interesting. Let’s consider the chart below.
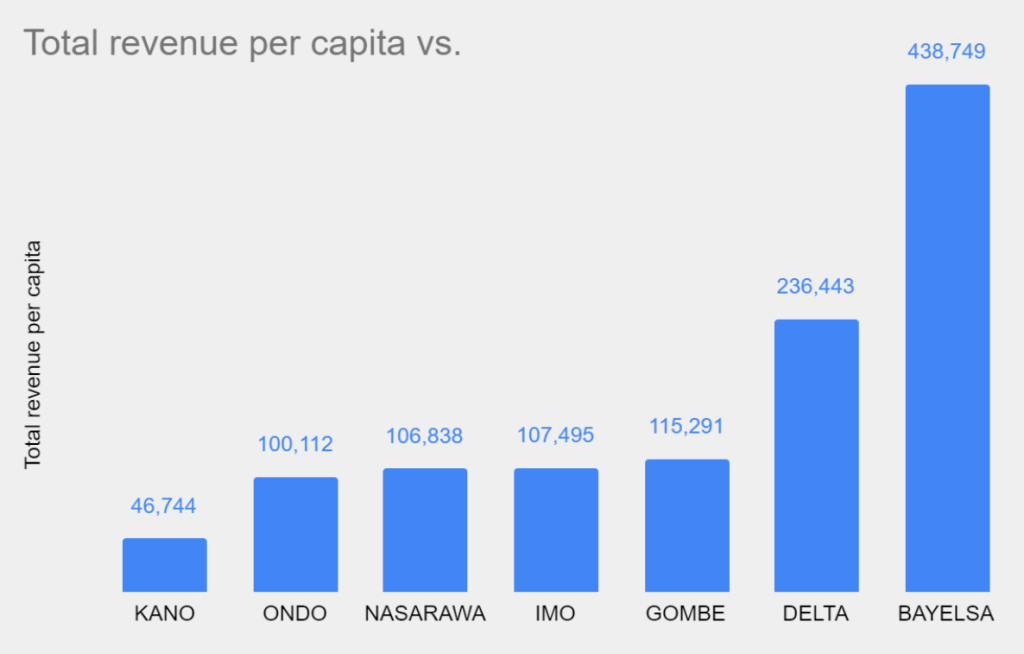
It can be seen that Nasarawa State, which generated the least revenue, spent more on recurrent expenditure than all the other seven states, including Delta which came in at the 3rd position despite its huge revenue pool. Interestingly, Kano which took the 3rd position in terms of revenue generation spent less on recurrent expenditure. From the last chart, it can be said that Kano State is taking meaningful strides towards development with her lower spending on recurrent expenditures. However, the issue of economic development is very technical and involves a lot of index factors. Therefore, the introduction of the income per head of these states, with the use of population figure of 2017 for the states, gives a more vivid dimension to our discourse as seen in the chart below.

This gives a different view because Bayelsa State, which occupies the 5th position in terms of percentage of recurrent expenditure spending, has the highest income per head. Delta State trailed behind and Kano occupied the lowest position. But how well are the people in these states faring? The Human Development Index (HDI) reveals the following amazing figures
State | Human Development Index (HDI) |
Bayelsa | 0.591 |
Delta | 0.556 |
Imo | 0.518 |
Nasarawa | 0.506 |
Ondo | 0.500 |
Gombe | 0.401 |
Kano | 0.359 |
Interestingly, Bayelsa State has the highest HDI, followed by Delta State in second place. Kano State is the last. Now, it’s important to note that Delta State has been in the first three positions throughout this report. What this means, therefore, is that Delta State is carefully taking conscious steps towards achieving economic development.
It is important to note, at this point, that economic growth and development can only be actualised when a government takes meaningful and more purposeful strides towards development. Unfortunately, the situation in many Nigerian states is very pathetic because they are taking rather giant strides towards economic downslide with their high expenditure profile. Note that the FASD report we are reviewing showed that between 2012 and 2016, Nigerian States spent over 50% of their total revenue on recurrent expenditure
State Expenditure
The NEITI review grouped the expenditure of the states into two broad categories namely Recurrent and Capital Expenditure.
Recurrent expenditures are those spent on the operating cost of running the state. These include personnel costs, overhead costs, pension and gratuities, consolidated revenue fund charges, and public debt expenditure.
Capital expenditures are those spent on projects in which “the benefit of the expenditure must be more than 12 calendar months”. These projects are executed to provide the infrastructure necessary for the development of the social and economic sector, healthcare and the environment, besides investment in technologies that drive efficiency in general administration.
The review analyses the revenue of some selected states in Nigeria and the total revenue received and generated by them. See below.
Table 1: Total Revenue of Selected State Governments (N ’billion)
State | 2012 | 2013 | 2014 | 2015 | 2016 | Total |
Nasarawa | 56.541 | 67.852 | 53.163 | 43.376 | 56.872 | 277.804 |
Gombe | 100.717 | 76.05 | 79.063 | 72.008 | 59.871 | 387.709 |
Bayelsa | 234.462 | 264.744 | 213.233 | 168.476 | 147.946 | 1,028.861 |
Delta | 300.443 | 318.437 | 304.153 | 290.916 | 168.657 | 1,382.606 |
Kano | 119.943 | 132.37 | 124.379 | 132.871 | 122.205 | 631.768 |
Imo | 119.19 | 126.151 | 142.653 | 133.263 | 79.065 | 600.322 |
Ondo | 130.444 | 107.683 | 104.047 | 71.885 | 67.877 | 481.936 |
Source: OAGF Disbursement Schedule 2012 – 2016 & State Validated Templates
During the year under review, Delta State recorded the highest pull of revenue while Gombe State had the least revenue. A review of the state’s recurrent expenditure is shown below:
Table 2: Recurrent Expenditure (N ’million)
State | 2012 | 2013 | 2014 | 2015 | 2016 | Total |
Delta | 162,472 | 175,328 | 202,778 | 219,503 | 152,285 | 912,366 |
Kano | 57,076 | 61,737 | 57,078 | 57,227 | 64,992 | 298,110 |
Imo | 91,142 | 80,262 | 96,444 | 93,911 | 47,226 | 408,985 |
Ondo | 70,798 | 66,169 | 77,235 | 78,146 | 60,585 | 352,933 |
Bayelsa | 158,108 | 172,525 | 157,270 | 116,787 | 90,105 | 694,795 |
Gombe | 41,403 | 48,086 | 51,996 | 50,781 | 46,959 | 239,225 |
Nasarawa | 46,055 | 45,749 | 74,531 | 37,444 | 39,615 | 216,394 |
Source: FASD Summary Report 2012 – 2016 Fiscal Year
The table below shows the percentage of their total revenue spent on recurrent expenditure.
Table 3: Percentage of Recurrent Expenditure to Total Revenue
State | 2012 | 2013 | 2014 | 2015 | 2016 |
Delta | 54% | 55% | 67% | 75% | 90% |
Kano | 48% | 47% | 46% | 43% | 53% |
Imo | 76% | 64% | 68% | 70% | 60% |
Ondo | 60% | 66% | 74% | 95% | 85% |
Bayelsa | 67% | 65% | 74% | 69% | 61% |
Gombe | 41% | 63% | 66% | 71% | 78% |
Nasarawa | 82% | 68% | 90% | 86% | 70% |
Source: FASD Summary Report 2012 – 2016 Fiscal Year
As we noted earlier, Delta State committed a huge percentage of its total revenue to recurrent expenditure, with the amount committed lowest in 2012 and then highest in 2016. This happens to be the trend for all the states reviewed because they all have the least percentage in 2012 and gradually increased their total recurrent expenditures in successive years. The year 2016 was the worst year because they spent more than 53% of their total revenue on recurrent expenditures.
In totality, NEITI’s review identified Delta State as the state with the highest proportion spent on recurrent expenditure and Nasarawa State being the least.
The NEITI review rightly noted that high recurrent expenditure of the states would negatively impact the available funds for capital expenditure, thereby denying the citizens the necessary infrastructure for their collective development.
What plans do the leaders of these states have for their citizens? Do they have any intention of moving the states towards development with their spending pattern? What future do the citizens of these states have to look forward to as their leaders keep spending most of the revenue allocated to them on “sundry” expenditures?
We all know that any economy that wishes to achieve economic development must be ready to spend most of its revenue on capital projects which will not only bring in more revenue but also create jobs and enhance the wellbeing of the citizens.
Nasarawa State and Delta State to have already recorded such high recurrent expenditure comparable to their respective revenue. We, hereby, recommend a total overhaul of the States’ expenditure mechanism and the administrative philosophy of the Government. All States reviewed should endeavour to re-evaluate their recurrent expenditure profile, most especially the overhead costs as put forward by the NEITI report.


